The Van Eck Sequence
This is a nice sequence as discussed in the Numberphile video above. There are only 2 rules:
- If you have not seen the number in the sequence before, add a 0 to the sequence.
- If you have seen the number in the sequence before, count how long since you last saw it.
You start with a 0.
0
You have never seen a 0 before, so the next number is 0.
00
You have seen a 0 before, and it was 1 step ago, so the next number is 1.
001
You have never seen a 1 before, so the next number is 0.
0010
You have seen a 0 before, it was 2 steps ago, so the next number is 2.
00102.
etc.
I can run a quick Python program (adapted from the entry in the Online Encyclopedia of Integer Sequences here) to find the first 100 terms.
A181391 = [0, 0]
for n in range(1, 10**2):
for m in range(n-1, -1, -1):
if A181391[m] == A181391[n]:
A181391.append(n-m)
break
else:
A181391.append(0)
print(A181391)
This returns:
[0, 0, 1, 0, 2, 0, 2, 2, 1, 6, 0, 5, 0, 2, 6, 5, 4, 0, 5, 3, 0, 3, 2, 9, 0, 4, 9, 3, 6, 14, 0, 6, 3, 5, 15, 0, 5, 3, 5, 2, 17, 0, 6, 11, 0, 3, 8, 0, 3, 3, 1, 42, 0, 5, 15, 20, 0, 4, 32, 0, 3, 11, 18, 0, 4, 7, 0, 3, 7, 3, 2, 31, 0, 6, 31, 3, 6, 3, 2, 8, 33, 0, 9, 56, 0, 3, 8, 7, 19, 0, 5, 37, 0, 3, 8, 8, 1, 46, 0, 6, 23]
I then assigned each term an x coordinate value, i.e.:
0 , 0
1 , 0
2 , 1
3 , 0
4 , 2
5 , 0
6 , 2
7 , 2
8 , 1
9 , 6
10 , 0
11 , 5
12 , 0
13 , 2
14 , 6
15 , 5
16 , 4
17 , 0
18 , 5
19 , 3
20 , 0
etc.
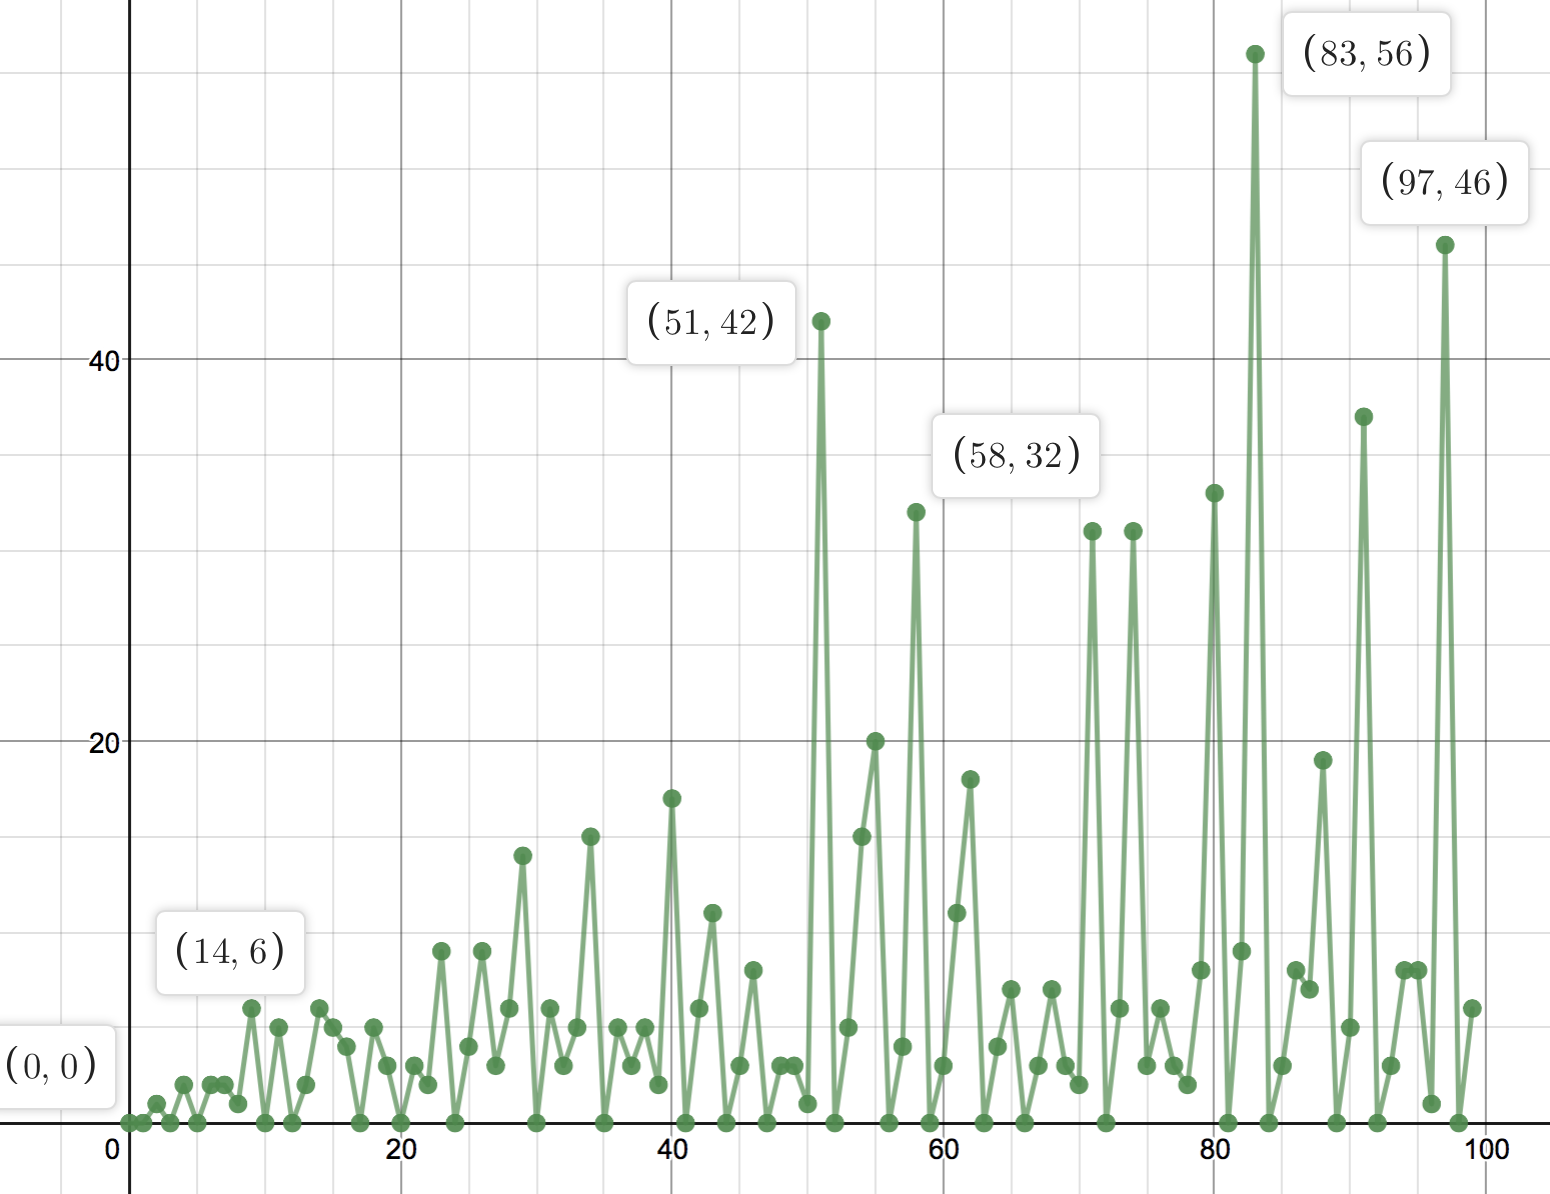
This means that you can then plot the sequence as a line graph, with the y values corresponding to the sequence terms. As you can see, every time we hit a new peak the following value is 0, leading to the peaks and troughs seen below:
Let’s extend the sequence to the first 1000 terms:

We can see that the line y = x provides a reasonably good upper bound for this data:

But it is not known if every number would actually appear in the sequence somewhere – so this bound may not hold for larger values.
Length of steps before new numbers appear.
We can also investigate how long we have to wait to see each number for the first time by running the following Python code:
A181391 = [0, 0]
for n in range(1, 10**3):
for m in range(n-1, -1, -1):
if A181391[m] == A181391[n]:
A181391.append(n-m)
break
else:
A181391.append(0)
for m in range(1,50):
if A181391[n]==m:
print(m, ",", n+1)
break
This returns the following data:
1 , 3
2 , 5
6 , 10
5 , 12
4 , 17
3 , 20
9 , 24
14 , 30
15 , 35
17 , 41
11 , 44
8 , 47
42 , 52
20 , 56
32 , 59
18 , 63
7 , 66
31 , 72
33 , 81
19 , 89
etc.
The first coordinate tells us the number we are interested in, and the second number tells us how long we have to wait in the sequence until it appears. So (1 , 3) means that we have to wait until 3 terms in the sequence to see the number 1 for the first time.
Plotting this for numbers 1-50 on a graph returns the following:

So, we can see (for example that we wait 66 terms to first see a 7, and 173 terms to first see a 12. There seems to be a general trend that as the numbers get larger we have to wait longer to see them. Testing this with a linear regression we can see a weak to moderate correlation:

Checking for the numbers up to 300 we get the following:

For example this shows that we have to wait 9700 terms until we see the number 254 for the first time. Testing this with a linear correlation we have a weaker positive correlation than previously.
So, a nice and quick investigation using a combination of sequences, coding, graphing and regression, with lots of areas this could be developed further.
IB teacher? Please visit my new site http://www.intermathematics.com ! Hundreds of IB worksheets, unit tests, mock exams, treasure hunt activities, paper 3 activities, coursework support and more. Take some time to explore!
Please visit the site shop: http://www.ibmathsresources.com/shop to find lots of great resources to support IB students and teachers – including the brand new May 2025 prediction papers.
Hi,
Very cool article.
Its important to note that you have 101 terms there:
[0, 0, 1, 0, 2, 0, 2, 2, 1, 6, 0, 5, 0, 2, 6, 5, 4, 0, 5, 3, 0, 3, 2, 9, 0, 4, 9, 3, 6, 14, 0, 6, 3, 5, 15, 0, 5, 3, 5, 2, 17, 0, 6, 11, 0, 3, 8, 0, 3, 3, 1, 42, 0, 5, 15, 20, 0, 4, 32, 0, 3, 11, 18, 0, 4, 7, 0, 3, 7, 3, 2, 31, 0, 6, 31, 3, 6, 3, 2, 8, 33, 0, 9, 56, 0, 3, 8, 7, 19, 0, 5, 37, 0, 3, 8, 8, 1, 46, 0, 6, 23]
The provided code is indented incorrectly and uses and obscure python feature of a for else.
Here is the “correct” code:
“`py
def example(terms: int):
A181391 = [0, 0]
for n in range(1, terms):
for m in range(n-1, -1, -1):
if A181391[m] == A181391[n]:
A181391.append(n-m)
break
else:
A181391.append(0)
return A181391
“`
also here is some “easier” to understand code:
“`py
def van_eck(n: int) -> list[int]:
if n < 1:
return []
seq = [0]
seen = {}
for i in range(n – 1):
cur = seq[i]
if cur in seen:
next = i – seen[cur]
seen[cur] = i
seq.append(next)
else:
seq.append(0)
seen[cur] = i
return seq
“`
Thank you for the article
My previous comment for formatted terribly so i put it in a paste bin:
https://pastebin.com/SPrQwfZh