
Buffon’s needle: Calculating pi
The following problem, first posed in the 1700s by the Comte de Buffon has a surprising solution which can be used to generate pi. This is a nice example of probability games which can generate mathematical results over repeated trials (the Monte Carlo method).
Here is the original problem:
“Suppose we have a floor made of parallel strips of wood, each the same width, and we drop a needle onto the floor. What is the probability that the needle will lie across a line between two strips?”
Generating pi

Let’s look at a modified version of this problem. I will start with a 10 x 10 cm piece of paper and draw a line across the middle. I will then drop a 2cm long needle randomly and record the number of times that this needle will cross the middle line.
We can simplify things further by considering the darker shaded region with 5cm width – as any needle dropping below this will certainly not cross the line, and by symmetry this will generate the same probability as a needle landing above the centre line.
Next we can use some basic trigonometry to define the distance BC – from the tip, B of the needle to the horizontal – as 2sin(theta) and to define the angle between the horizontal and AB as theta. We will define the distance d as the distance from the tip, A of the needle to the middle line.
We can see that if:

then the needle will cross the centre line.
Next we note that the needle’s orientation, O in the region VWTU can be described completely by polar coordinates (theta,d). This means that for a given angle to the horizontal, theta, and a given distance d, from the blue line to A, there is a unique orientation of the needle.
Therefore we have:

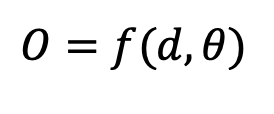
For each fixed coordinate location of A (with a fixed d value) the value of theta can vary from 0 to pi. This therefore gives:
 And as we are just considering the rectangle VWTU we can see that the maximum distance A could be from the blue line is 0 and the minimum distance could be 5 . Therefore:
 We can therefore plot a polar coordinate graph of d against theta:

The region in which the needle will cross the middle line will be below the curve. We can calculate this area using calculus:

We next calculate the area of the rectangle:

So the probability of a needle crossing this line, P_c is given by:

Which we can then rearrange to give:

So – we can now simply carry out this experiment a large number of times and then use this formula to now gain an ever closer approximation to pi.
In general for a needle length L and square box with dimensions D, we have:

and if we choose the special case of L = D/4 this then reduces to:

This is a nice example of how mathematical constants can appear as if by magic from unexpected places. Try the experiment yourselves!
IB teacher? Please visit my new site http://www.intermathematics.com ! Hundreds of IB worksheets, unit tests, mock exams, treasure hunt activities, paper 3 activities, coursework support and more. Take some time to explore!
Please visit the site shop: http://www.ibmathsresources.com/shop to find lots of great resources to support IB students and teachers – including the brand new May 2025 prediction papers.