
Roll or bust? A strategy for dice games
Let’s explore some strategies for getting the best outcome for some dice games.
Game 1: 1 dice, bust on 1.
We roll 1 dice. However we can roll as many times as we like and add the score each time. We can choose to stop when we want. However If we roll a 1 at anytime then we are bust, lose all out points and the game is over.
What is the best strategy for this game?
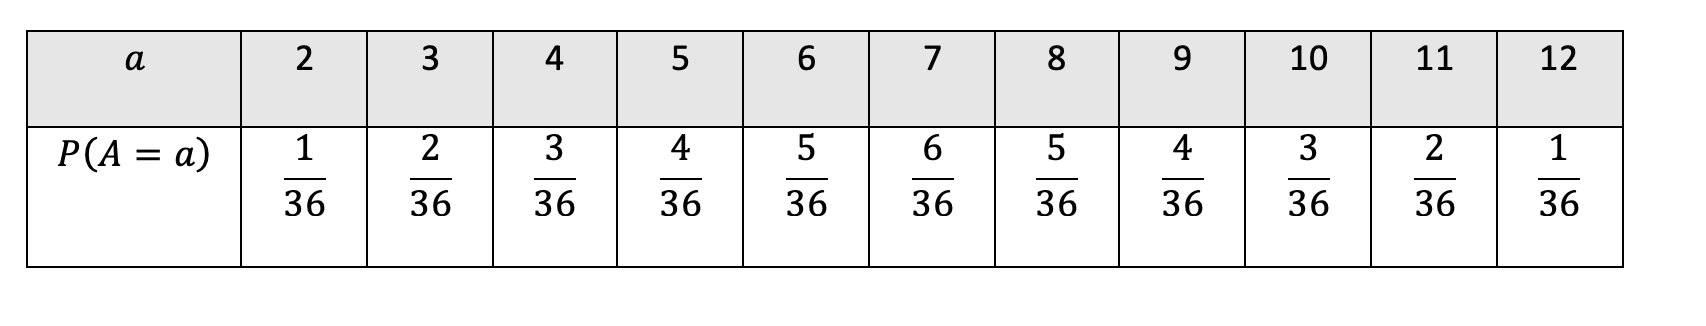
We can start with the following probabilities for getting each score:
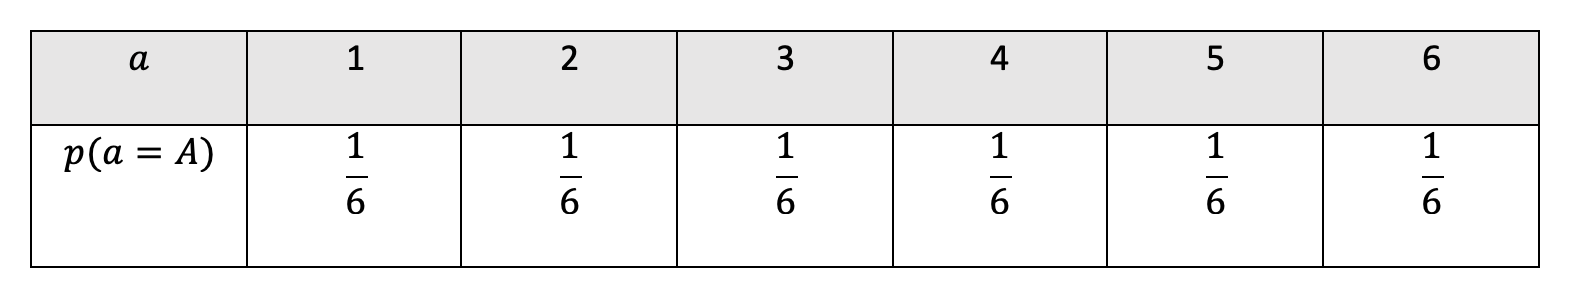
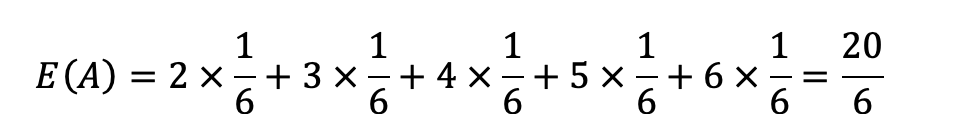
We can then find the expected score per roll:
We can then work out the probabilities of avoiding going bust after x rolls:

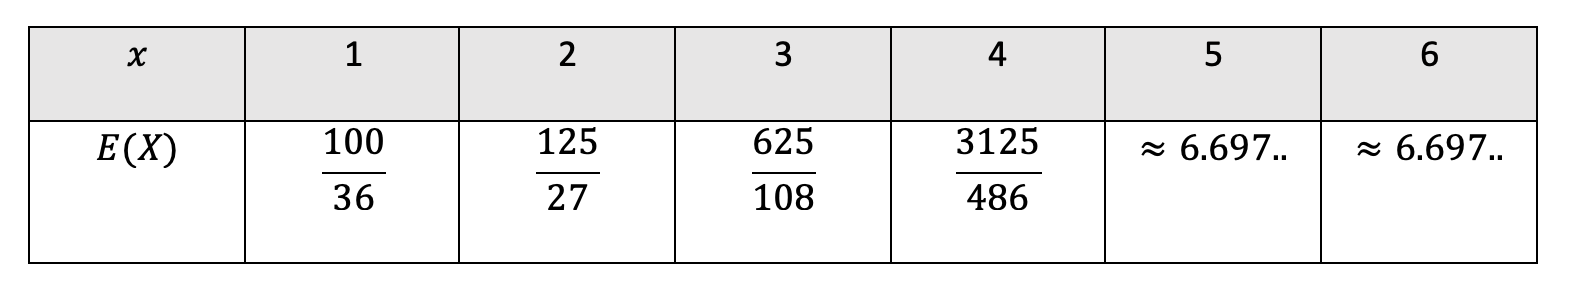
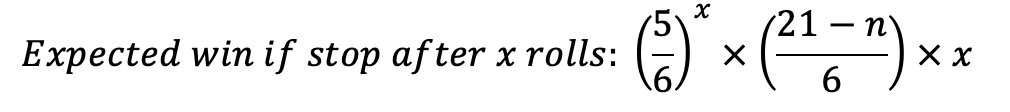
We can then see how much we would expect to make if we stop after x rolls:

We can work out these expectations in a table:
We can then plot this on a graph:
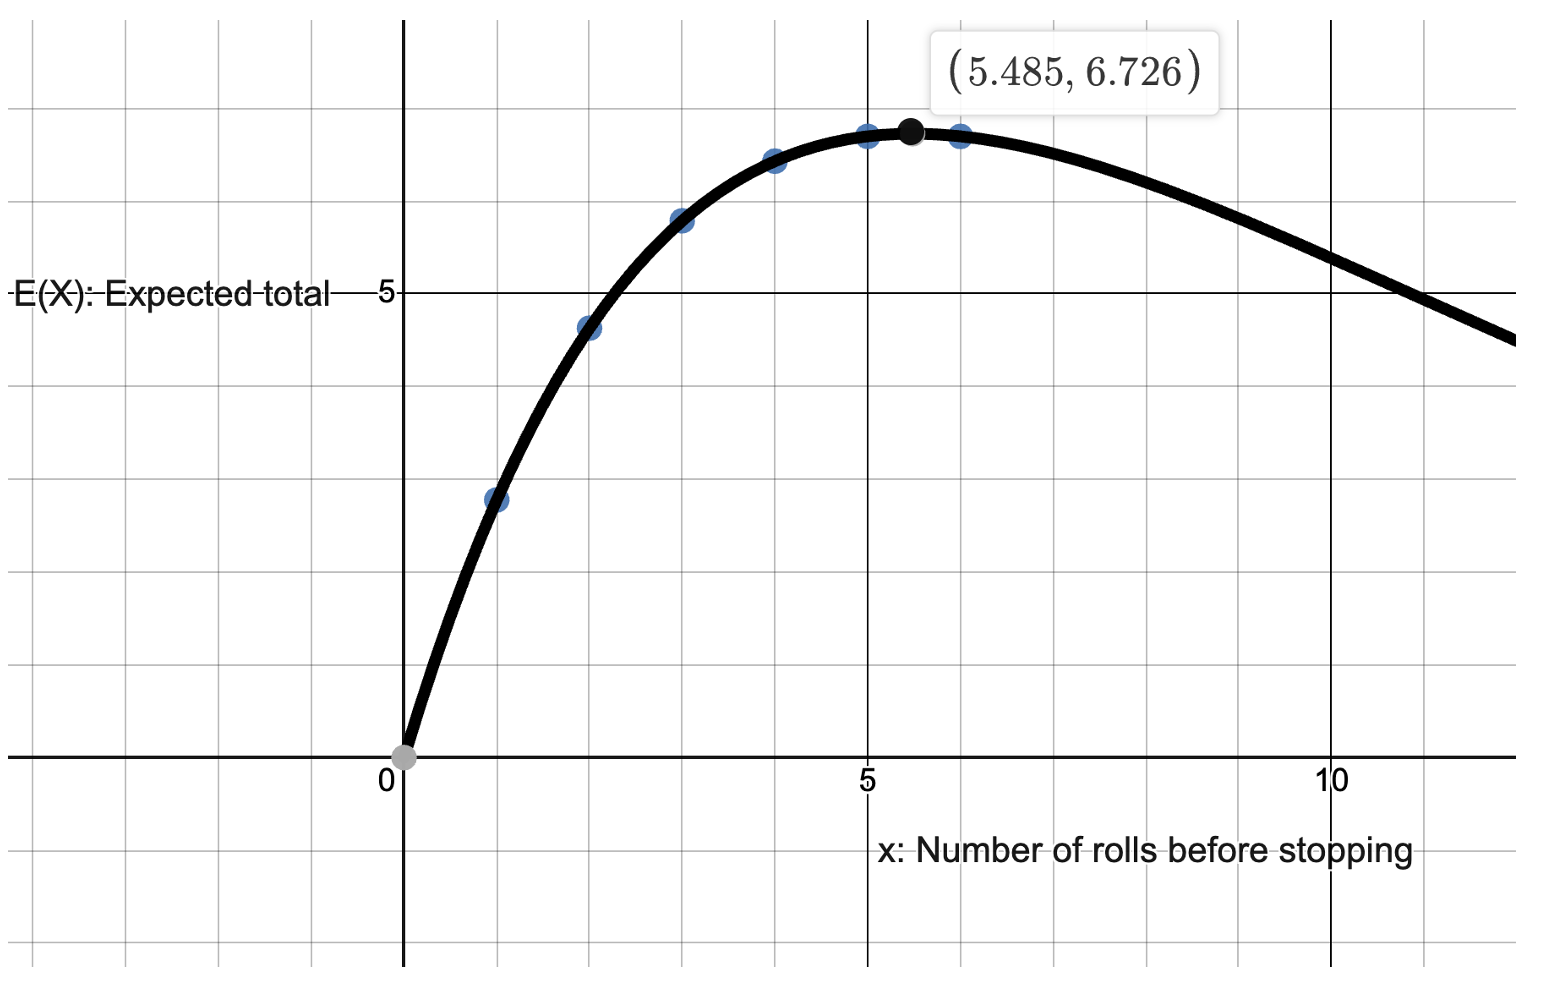
From this we can see that the optimum strategy is to roll the dice either 5 or 6 times and then stop. Doing this gives an expected total of 6.7.
Game 2: 1 dice, bust on number n.
We can extend this to being the same game, but bust on any number (n) from 1-6. This gives us the following general equation for an expected win:
And we we plot this for the possible values of n = [1,2,3,4,5,6] we can see the following graph:
 We can notice that all the maximum points lie on the same vertical line x = 5.485, so in all cases the optimum strategy remains to roll either 5 or 6 times.
Game 3: 2 dice, bust on n.
Now we roll 2 dice each time. We can choose to stop when we want. However if we roll a specified number n at anytime then we are bust, lose all out points and the game is over.
Let’s see what the probabilities look like for this game:
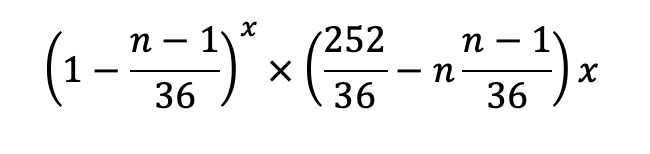
Following the same method as the previous game we might hope that the general equation for the expected value is given by:
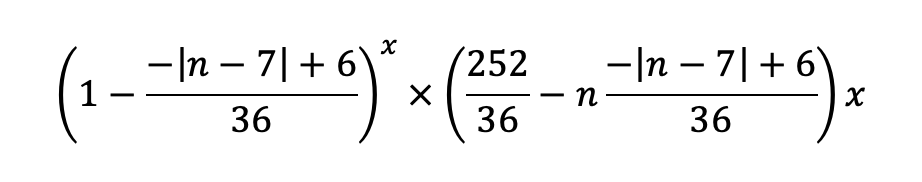
This does indeed work for values of n up until 7, but then doesn’t work for 8 and above. So we need a function which has symmetry about n = 7, with linear increase followed by linear decrease. The function we need is the modulus function. With some idea of transformations we can arrive at:
When we plot this for n = [2,3,4,5,6,7,8,9,10,11,12] we can see the following:
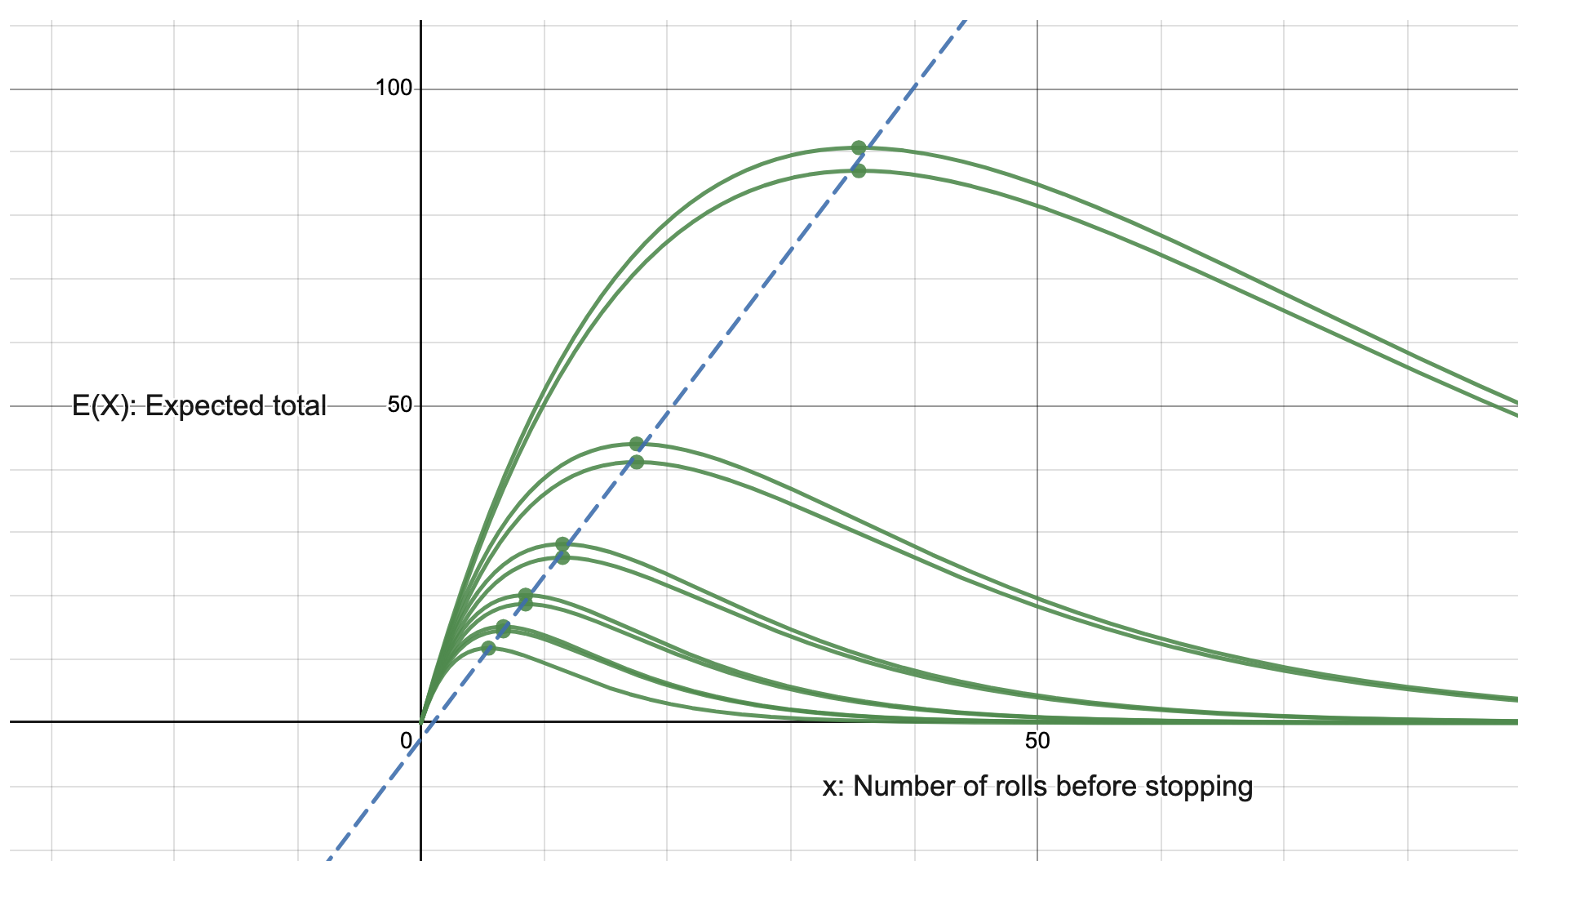
To break this down further we can notice that (as we would expect) when n = 2 we have the best expected total, which then declines until n=7:

We then see the expected values rise again for n = 8 onwards:

We can also notice that the maximum points of the curves lie closely on the linear regression for y = 2.57x -2.54.
So, if you play this game with 2 being the bust number, you should roll either 35 or 36 times – and would expect a score of 90.7. With 7 being the bust number you should roll between 5 and 6 times and will expect a score of 11.8.
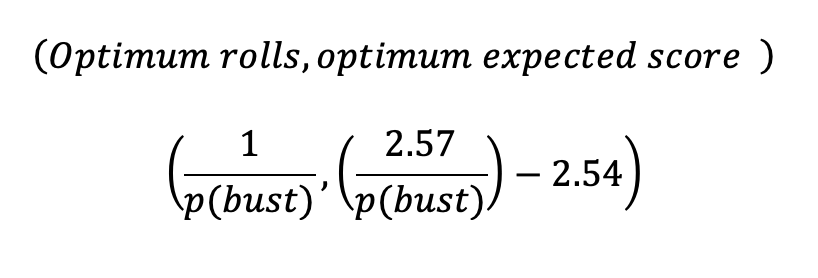
We can also notice that for both games, so can quickly calculate the number of optimum rolls by simply looking at the probability of failure per round. When the probability of failure is 1/36 then we can roll 36 times. When the probability of failure is 1/18 then we can roll 18 times.
So putting that together we have a quick approximation which allows us to calculate both the optimum number of rolls and also the expected total:
Let’s check this works:
For when n = 3, the probability of being bust is 2/36, therefore according to our equation we should roll 18 times and would expect a total of around 43.7. This is pretty close to our actual result of 43.96.
Let’s try when n = 7. Now the probability of being bust is 6/36, therefore we should roll 6 times and expect a total of 12.88. Here we see the actual result is 11.7. This is the least accurate of all the predictions – off by around 10%.
So – a reasonable approximation to get a rough result for this dice game!
IB teacher? Please visit my new site http://www.intermathematics.com ! Hundreds of IB worksheets, unit tests, mock exams, treasure hunt activities, paper 3 activities, coursework support and more. Take some time to explore!
Please visit the site shop: http://www.ibmathsresources.com/shop to find lots of great resources to support IB students and teachers – including the brand new May 2025 prediction papers.
Leave a Reply