
Google Page Rank: Billion dollar maths
In the early 1990s search engines used to be text based – and would rank pages based on how many times a key word appeared. But this did not discriminate between useful pages and less useful pages. Larry Page and Segei Brin used some maths to come up with an alternative method of ranking pages and made a trillion dollar company!
Let’s see the basis of Google’s page ranking by starting with the following 4 websites:
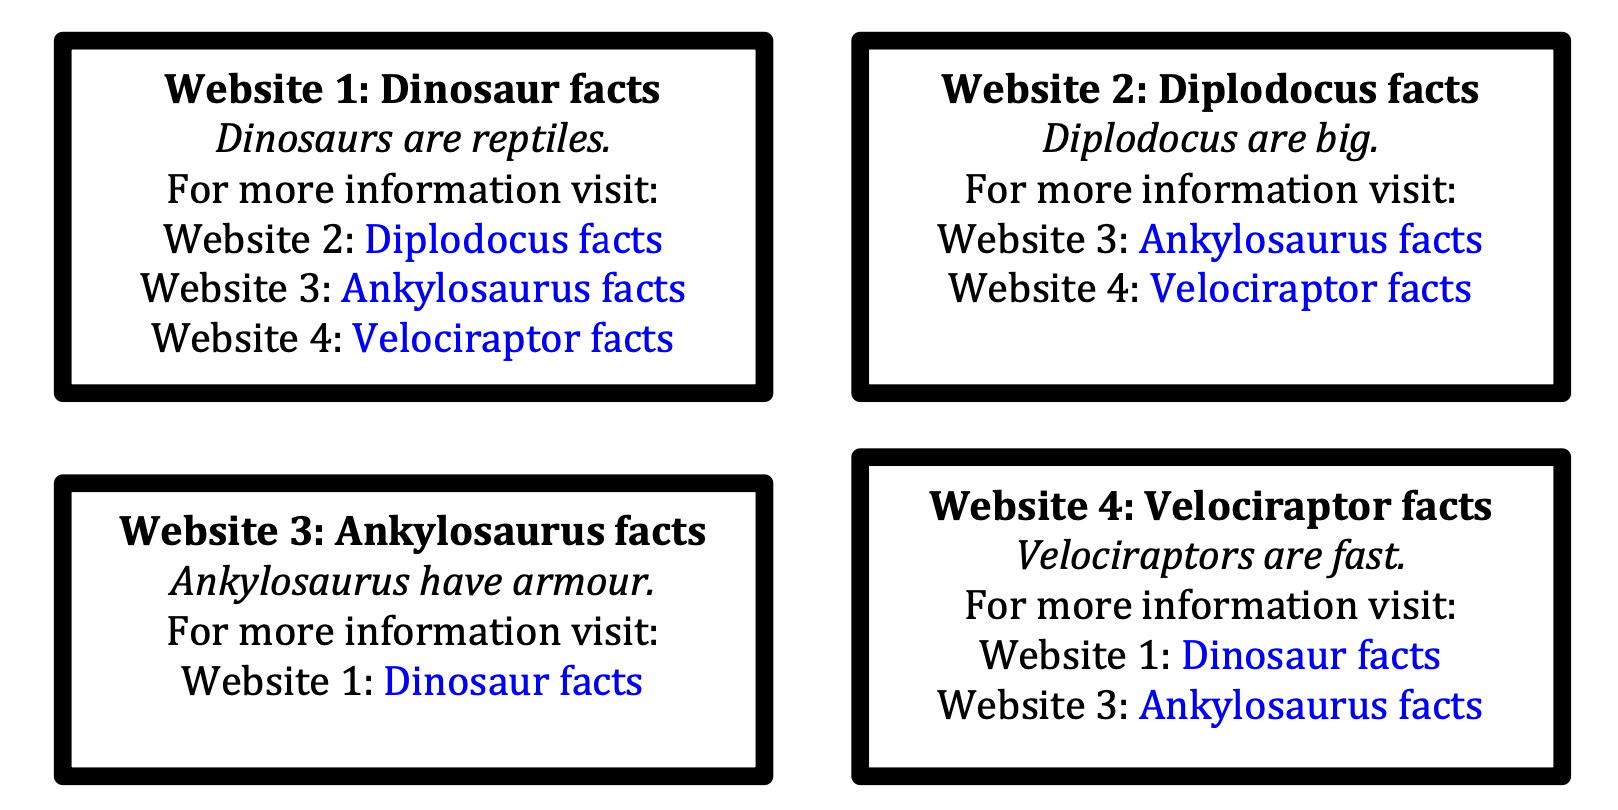
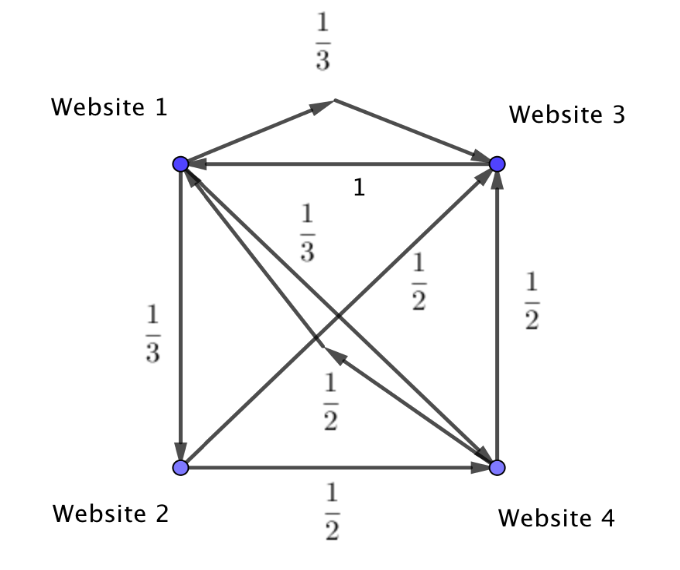
We can see that Website 1 links to 3 other sites. Therefore randomly clicking on these links would lead to a 1/3 probability of landing on each of the other 3 sites. I then can draw arrows from Website 1 to each of the other websites and mark the probability as 1/3 for all of these paths. We can see that Website 2 links to 2 other sites – and so randomly clicking on these links will lead to a 1/2 probability of landing on Website 3 or 4. Continuing this method creates the following graph:
We then represent this information in a 4 by 4 matrix where each column represents each of the websites. So the first column represents Website 1 and each of the values are the probability of landing on Website 1, 2, 3, 4 respectively. The second column represents the probability of landing on Website 1, 2, 3, 4 respectively when starting at Website 2. We continue this to give the following:

The Google Algorithm was then able to see how often each site was linked to, and also able to give extra weight to links from sites that themselves were linked to often. In effect the more links to a site, the “better” that site is considered to be and the more value that links from that site are given.
They could then “rank” sites by considering the steady state of a transition matrix which would show the long term average probabilities of arriving at each page when randomly clicking on links to sites. To do this with a GDC we can simply raise the matrix above to a large power.
In this case (say):
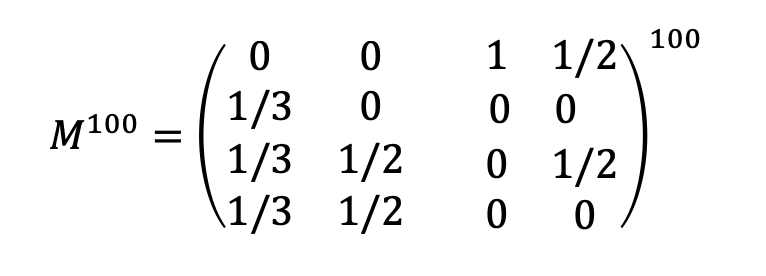
We notice when we do this that each column is the same to 3sf – i.e. it doesn’t matter where we start, the probability of landing on each site over time is the same:

This means that randomly clicking will lead to a 0.387 chance of landing on Website 1 etc. So we can rank them in order as Website 1, Website 3, Website 4, Website 2.
Another example:
Let’s look at the following 4 websites:

As before we can draw a graph mapping the connections:

If we then create a matrix and raise to a high power we will be able to see the steady state:
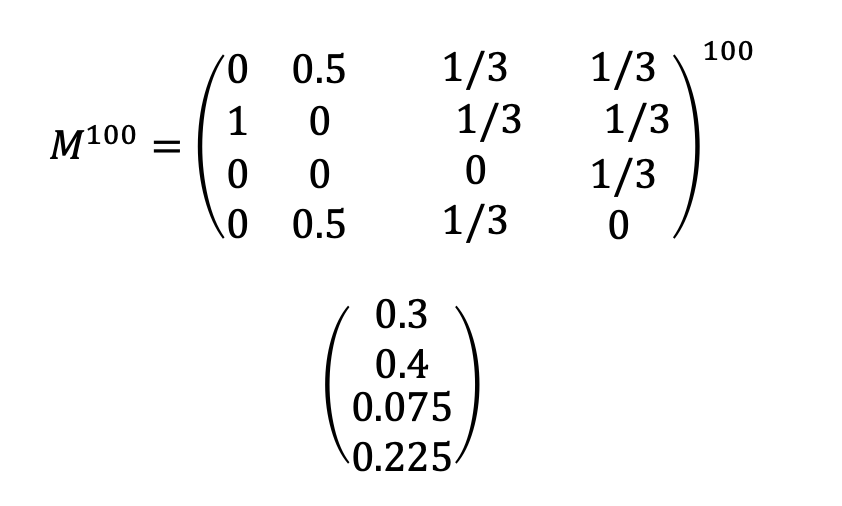
This shows we would rank as follows:
Rank: Guardian, BBC, Daily Mail, CNN
Now, clearly the Google algorithm is more sophisticated – and has been refined to take in lots of other factors, but at its heart this is the idea that reovlutionised search – by deciding to reward websites that other sites linked to (i.e that had authority) and thus creating a measurement of quality. Mathematically quite simple – but a very lucrative idea!
IB teacher? Please visit my new site http://www.intermathematics.com ! Hundreds of IB worksheets, unit tests, mock exams, treasure hunt activities, paper 3 activities, coursework support and more. Take some time to explore!
Please visit the site shop: http://www.ibmathsresources.com/shop to find lots of great resources to support IB students and teachers – including the brand new May 2025 prediction papers.