You are currently browsing the tag archive for the ‘teaching mathematics’ tag.

Joh-RiemannSphere01

The Riemann Sphere

The Riemann Sphere is a fantastic glimpse of where geometry can take you when you escape from the constraints of Euclidean Geometry – the geometry of circles and lines taught at school.  Riemann, the German 19th Century mathematician, devised a way of representing every point on a plane as a point on a sphere.  He did this by first centering a sphere on the origin – as shown in the diagram above.  Next he took a point on the complex plane (z = x + iy ) and joined up this point to the North pole of the sphere (marked W).  This created a straight line which intersected the sphere at a single point at the surface of the sphere (say at z’).  Therefore every point on the complex plane (z) can be represented as a unique point on the sphere (z’) – in mathematical language, there is a one-to-one mapping between the two.  The only point on the sphere which does not equate to a point on the complex plane is that of the North pole itself (W).  This is because no line touching W and another point on the sphere surface can ever reach the complex plane.  Therefore Riemann assigned the value of infinity to the North pole, and therefore the the sphere is a 1-1 mapping of all the points in the complex plane (and infinity).

Riemann 2

So what does this new way of representing the two dimensional (complex) plane actually allow us to see?  Well, it turns on its head our conventional notions about “straight” lines.  A straight line on the complex plane is projected to a circle going through North on the Riemann sphere (as illustrated above).  Because North itself represents the point at infinity, this allows a line of infinite length to be represented on the sphere.

riemann sphere

Equally, a circle drawn on the Riemann sphere not passing through North will project to a circle in the complex plane (as shown in the diagram above).  So, on the Riemann sphere – which remember is isomorphic (mathematically identical) to the extended complex plane, straight lines and circles differ only in their position on the sphere surface.  And this is where it starts to get really interesting – when we have two isometric spaces there is no way an inhabitant could actually know which one is his own reality.  For a two dimensional being living on a Riemann sphere,  travel in what he regarded as straight lines would in fact be geodesic (a curved line joining up A and B on the sphere with minimum distance).

By the same logic, our own 3 dimensional reality is isomorphic to the projection onto a 4 dimensional sphere (hypersphere) – and so our 3 dimensional universe is indistinguishable from a a curved 3D space which is the surface of a hypersphere.  This is not just science fiction – indeed Albert Einstein was one to suggest this as a possible explanation for the structure of the universe.  Indeed, such a scenario would allow there to be an infinite number of 3D universes floating in the 4th dimension – each bounded by the surface of their own personal hypersphere.  Now that’s a bit more interesting than the Euclidean world of straight lines and circle theorems.

If you liked this you might also like:

Imagining the 4th Dimension. How mathematics can help us explore the notion that there may be more than 3 spatial dimensions.

The Riemann Hypothesis Explained. What is the Riemann Hypothesis – and how solving it can win you $1 million

Are You Living in a Computer Simulation? Nick Bostrom uses logic and probability to make a case about our experience of reality.

Essential resources for IB students:

1) Exploration Guides and Paper 3 Resources

Screen Shot 2021-05-19 at 6.32.13 PM

I’ve put together four comprehensive pdf guides to help students prepare for their exploration coursework and Paper 3 investigations. The exploration guides talk through the marking criteria, common student mistakes, excellent ideas for explorations, technology advice, modeling methods and a variety of statistical techniques with detailed explanations. I’ve also made 17 full investigation questions which are also excellent starting points for explorations.  The Exploration Guides can be downloaded here and the Paper 3 Questions can be downloaded here.

divisibility tests

Divisibility tests allow us to calculate whether a number can be divided by another number.  For example, can 354 be divided by 3?  Can 247,742 be divided by 11?  So what are the rules behind divisibility tests, and more interestingly, how can we prove them?

Divisibility rule for 3

The most well known divisibility rule is that for dividing by 3.  All you need to do is add the digits of the number and if you get a number that is itself a multiple of 3, then the original number is divisible by 3.  For example, 354 is divisible by 3 because 3+5+4 = 12 and 12 can be divided by 3.

We can prove this using the modulo function.  This allows us to calculate the remainder when any number is divided by another.  For example, 21 ≡ 3 (mod 6).  This means that the remainder when 21 is divided by 6 is 3.

So we first start with our number that we want to divide by 3:

n = a + 10b + 100c + 1000d + …….

Now, dividing by 3 is the same as working in mod 3, so we can rewrite this n in terms of mod 3:

n = a + 1b + 1c + 1d + ……. (mod 3)

(this is because 10 ≡ 1 mod 3, 100 ≡ 1 mod 3, 1000 ≡ 1 mod 3 etc)

Now, for  a number to be divisible by 3 this sum needs to add to a multiple of 3.  Therefore if a + b + c + d + …. ≡ 0 (mod 3) then the original number is also divisible by 3.

Divisibility rule for 11

This rule is much less well known, but it’s quite a nice one.  Basically you take the digits of any number and alternately subtract and add them.  If the answer is a multiple of 11 (or 0) then the original number is divisible by 11.  For example, 121 is a multiple of 11 because 1-2+1 = 0.  247,742 is because 2-4+7-7+4-2 = 0.

Once again we can prove this using the modulo operator.

n = a + 10b +100c + 1000d + …..

and this time work in mod 11:

n = a + -1b +1c + -1d + ….. (mod 11)

this is because for ease of calculation we can write 10 ≡ -1 (mod 11).  This is because -1 ≡ 10 ≡ 21 ≡ 32 ≡ 43 (mod 11).  All numbers 11 apart are the same in mod 11.  Meanwhile 100 ≡ 1 (mod 11).  This alternating pattern will continue.

Therefore if we alternately subtract and add digits, then if the answer is divisible by 11, then the original number will be as well.

Palindromic Numbers

Palindromic numbers are numbers which can be read the same forwards as backwards.  For example, 247,742 is a palindromic number, as is 123,321.  Any palindromic number which is an even number of digits is also divisible by 11.  We can see this by considering (for example) the number:

n = a + 10b + 100c + 1000c + 10,000b + 100,000a

Working in mod 11 we will then get the same pattern as previously:

n = a – b +c – c +b – a (mod 11)

so n = 0 (mod 11).  Therefore n is divisible by 11.  This only works for even palindromic numbers as when the numbers are symmetric they cancel out.

Essential resources for IB students:

1) Exploration Guides and Paper 3 Resources

Screen Shot 2021-05-19 at 6.32.13 PM

I’ve put together four comprehensive pdf guides to help students prepare for their exploration coursework and Paper 3 investigations. The exploration guides talk through the marking criteria, common student mistakes, excellent ideas for explorations, technology advice, modeling methods and a variety of statistical techniques with detailed explanations. I’ve also made 17 full investigation questions which are also excellent starting points for explorations.  The Exploration Guides can be downloaded here and the Paper 3 Questions can be downloaded here.

premier league regression

In sports leagues around the world, managers are often only a few bad results away from the sack – but is this all down to a misunderstanding of statistics?

According to the Guardian, in the 21 year history of the Premier League, approximately 140 managers have been sacked. In more recent years the job is getting ever more precarious – 12 managers lost their jobs in 2013, and 20 managers in the top flight have been shown the door in the last 2 years. Indeed, there are now only three Premier League managers who have held their position for more than 2 years (Arsene Wenger, Sam Allardyce and Alan Pardew).

Owners appear attracted to the idea that a new manager can bring a sudden improvement in results – and indeed most casual observers of football would agree that new managers often seem to pull out some good initial results. But according to Dutch economist Dr Bas ter Weel this is just a case of regression to the mean – if a team has been underperforming relative to their abilities then over the long run we would expect them to improve to get closer to the mean value.

As the BBC reported:

“Changing a manager during a crisis in the season does improve the results in the short term,” Dr Bas ter Weel says. “But this is a misleading statistic because not changing the manager would have had the same result.”

Ter Weel analysed managerial turnover across 18 seasons (1986-2004) of the Dutch premier division, the Eredivisie. As well as looking at what happened to teams who sacked their manager when the going got tough, he looked at those who had faced a similar slump in form but who stood by their boss to ride out the crisis.

He found that both groups faced a similar pattern of declines and improvements in form.

By looking at the graph at the top of the page it is clear to see that sacking a manager may have appeared to lead to an improvement in results – but that actually had the manager not been sacked results would have been even better!

We can understand regression to the mean better by considering coin tosses as a crude model for football games (ignoring draws).   If we get a head the team wins, if we get a tail the team loses.   So this is a distinctly average team – which over a season we would expect to finish around mid-table.  However over that season they will have “good runs” and “bad runs.”

regression

This graphic above is the result of 38 coin tosses (the length of a Premier League season).  Even though it’s the result of random throws you can see a run of 6 wins in a row – a good run.  There’s also a run of 8 defeats and only 2 wins in 10 games – which would have more than a few Chairman thinking about getting a new manager.

Being aware of regression to the mean – i.e that over the long term results tend towards the mean would help owners to have greater confidence in riding out “bad runs” – and maybe would keep a few more managers in their jobs.

You can read the original research paper here.

Essential resources for IB students:

1) Exploration Guides and Paper 3 Resources

Screen Shot 2021-05-19 at 6.32.13 PM

I’ve put together four comprehensive pdf guides to help students prepare for their exploration coursework and Paper 3 investigations. The exploration guides talk through the marking criteria, common student mistakes, excellent ideas for explorations, technology advice, modeling methods and a variety of statistical techniques with detailed explanations. I’ve also made 17 full investigation questions which are also excellent starting points for explorations.  The Exploration Guides can be downloaded here and the Paper 3 Questions can be downloaded here.


The Battle over Homework: Marking in Mathematics

homework

Within five minutes of any teaching inspection from OFSTED, the inspector will be leafing through students’ exercise books in search of evidence of regular and meaningful marking. If it’s not there then they will probably already be penciling in the “requires improvement” column. With no-notice inspections now in the UK, and with such high stakes for Senior Management, there is ever greater pressure and expectation on UK teachers for “OFSTED ready” marking – with all the significant increase in workload that this entails. Yet, how much discussion ever takes place as to how effective such marking is for mathematics?

Dr Harris Cooper of Duke University, one of the few academics to really research homework policies in depth, provides compelling evidence of the need to rethink marking strategies through a meta-analysis of research on the subject. He cites 47 studies which demonstrate that the act of setting homework itself, regardless of whether grading or comments were provided has a positive benefit for students.

There are much fewer studies specifically looking at grading strategies – but here again they run contrary to accepted norms. Three studies which looked at different homework grading strategies – marking every problem, marking a random sample, marking for accuracy or marking for completeness were found to have no difference in student attainment. Five more studies meanwhile suggest there is little difference in attainment when students are provided with comments as a pose to grades.

One study cited was that by J Austin looking at whether comments on homework affected student performance. Researchers found that in 7 of the 9 classes in the study, there was no significance in raised mathematical performance between students who received comments instead of simple grades.

This probably makes sense to anyone who has ever marked maths homework before – either students will get everything correct, or most students will get the same question wrong. Rather than spending 40 minutes writing out 20 explanations of how to use Pythagoras’ rule correctly, surely it makes more sense to spend 2 minutes at the start of the next lesson explaining (or getting a student to explain) it to the whole class?

Mathematics marking is also an area which computer programs can provide huge benefits. Websites like MyMaths allow students to be set targeted homework, which they can have marked in real time. These homework tasks are accompanied by lesson content so that students who do get questions wrong can then go back to the lesson, review the material and then resubmit their homework again. The evidence clearly shows that specific, immediate feedback raises attainment – and such programs not only do this, but also encourage students to become self-learners in the process.

A couple of recent studies looking at the effectiveness of web-based marking versus traditionally graded marking in university students found no significant difference in overall student performance between different approaches – and found that web-based homework both increased the students’ time spent on the task and provided greater opportunities for them to recognise and correct errors.

Given such evidence it is depressing that so many school leaders and OFSTED inspectorate remain wedded to the importance of using comments in exercise books as a core method of assessing teaching.

Central to this discussion should instead be the concept of greatest teaching efficiency – i.e. what is the most effective use of teaching time to maximise student attainment. Current policies effectively ignore this question completely, and work on the assumption that there is no upper limit to working hours in a day and that all new strategies will have no detrimental effect on other ones. The reality is the reverse, new strategies squeeze out old ones, overwork leads to increased stress and an overall drop in both student-teacher relations and teaching standards.

A more honest approach would be to start with a fixed idea for the number of hours per week staff members should be expected to work – whether that be 45 hours, 50 hours or more. Once that figure is fixed then it simply becomes a case of working backwards – filling in those hours with various teaching responsibilities. Doing this then forces a genuine debate as to what is the most effective use of teaching time – 5 hours a week marking books or an extra 5 hours a week planning lessons, organising gifted and talented events, or holding after school revision sessions. Which strategy actually has the greatest impact on attainment?

Immediate, targeted verbal feedback within the classroom setting has been shown to to have one of the greatest impacts on attainment. Comments for maths homework do little to raise attainment over simple grading, and web based programs offer both immediate feedback and the opportunity for students to become self-learners. None of these appear as evidence in a two minute flick through of a student book – but what evidence does this actually provide? Maybe it’s time to challenge the existing marking paradigm.

This classic clip “proves” how 25/5 = 14, and does it three different ways.  Maths is a powerful method for providing proof – but we need to be careful that each step is based on correct assumptions.

One of the most well known fake proofs is as follows:

let a = b
Then a2 = ab
a2 – b2 = ab – b2
(a-b)(a+b) = b(a-b)
a+b = b (divide by a-b )
b+b = b (as a = b)
2b = b
2 = 1

Can you spot the step that causes the proof to be incorrect?

Another well known maths problem that appears to prove the impossible is the following:

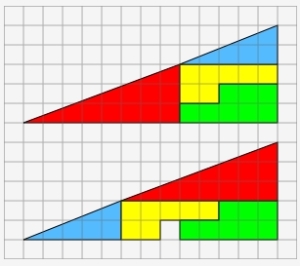
curry's

This was created by magician Paul Curry – and is called Curry’s Paradox.  You can work out the areas of all the 4 different coloured shapes on both triangles, and yet by simply rearranging them you created a different area.

A third “proof” shows that -1 = 1:

Let a = b = -1
a2 = b2
2a2 = 2b2
a2 = 2b2 – a2
a = √(2b2 – a2)
a = √(2(-1)2 – (-1)2)
a = √(1)
-1 = 1

And finally a proof that 1= 0.  This last proof was used by Italian mathematician Guido Ubaldus as an example of a proof of God because it showed how something could appear from nothing.

0 = 0 + 0 + 0 + 0 ……
0 = (1-1) + (1-1) + (1-1) + (1-1) ……
0 = 1-1+1-1+1….
0 = 1 + (-1+1 ) + (-1+1) + ….
0 = 1

So, maths is a powerful tool for convincing people of an argument – but you always need to make sure that the maths is accurate!  If you want to see the problems in the above proofs, highlight below (explanation in white text):


1) We divide by (a-b) in the 5th line. As a = b, then (a-b) = 0. We can’t divide by zero!
2) Neither of the “triangles” are in fact triangles – the hypotenuse is not actually straight. This discrepancy allows for the apparent paradox.
3) In the second to last line we square root 1, but this has 2 possible answers, 1 or -1. As a is already defined as a = -1 then there is no contradiction.
4) This is very similar to the Cesaro Summation problem which exercised mathematicians for centuries. The infinite summation of 0 + 0 + 0 + 0 … is not the same as the infinite summation 1 – 1 + 1 – 1 + 1 ….

War Maths – Projectile Motion

Despite maths having a reputation for being a somewhat bookish subject, it is also an integral part of the seamier side of human nature and has been used by armies to give their side an advantage in wars throughout the ages.  Military officers all need to have a firm grasp of kinematics and projectile motion – so let’s look at some War Maths.

Cannons have been around since the 1200s – and these superseded other siege weapon projectiles such as catapults which fired large rocks and burning tar into walled cities.  Mankind has been finding ever more ingenious ways of firing projectiles for the best part of two thousand years.

projectile motion

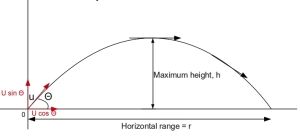
The motion of a cannon ball can be modeled as long as we know the initial velocity and angle of elevation. If the initial velocity is Vi and the angle of elevation is θ, then we can split this into vector components in the x and y direction:

Vxi = Vicosθ (Vxi is the horizontal component of the initial velocity Vi)
Vyi = Visinθ  (Vyi is the vertical component of the initial velocity Vi)

Next we know that gravity will affect the motion of the cannonball in the y direction only – and that gravity can be incorporated using g (around 9.8 m/s2 ) which gives gravitational acceleration.  Therefore we can create 2 equations giving the changing velocity in both the x direction (Vx) and y direction (Vy):

Vx = Vicosθ
Vy = Visinθ – gt

To now find the distance traveled we use our knowledge from kinematics – ie. that when we integrate velocity we get distance.  Therefore we integrate both equations with respect to time:

Sx = x =  (Vicosθ)t
Sy = y =  (Visinθ)t – 0.5gt2

We now have all the information needed to calculate cannon ball projectile questions.  For example if a cannon aims at an angle of 60 degrees with an initial velocity of 100 m/s, how far will the cannon ball travel?

Step (1) We find out when the cannon ball reaches maximum height:

Vy = Visinθ – gt = 0
100sin60 – 9.8(t) = 0
t ≈ 8.83 seconds

Step (2) We now use the fact that a parabola is symmetric around the maximum – so that after 2(8.83) ≈ 17.7 seconds it will hit the ground.  Therefore substitute 17.7 seconds into the equation for Sx = (Vicosθ)t.

Sx =  (Vicosθ)t
Sx =  (100cos60).17.7
Sx  ≈ 885 metres

So the range of the cannon ball is just under 1km.  You can use this JAVA app to model the motion of cannon balls under different initial conditions and also factor in air resistance.

There are lots of other uses of projectile motion – the game Angry Birds is based on the same projectile principles as shooting a cannon, as is stunt racing – such as Evel Knieval’s legendary motorbike jumps:

If you enjoyed this post you might also like:

Bridge Building Lesson Plan. A lesson to introduce a practical example of maths and engineering.

Langton’s Ant – Order out of Chaos How computer simulations can be used to model life.

Essential resources for IB students:

1) Exploration Guides and Paper 3 Resources

Screen Shot 2021-05-19 at 6.32.13 PM

I’ve put together four comprehensive pdf guides to help students prepare for their exploration coursework and Paper 3 investigations. The exploration guides talk through the marking criteria, common student mistakes, excellent ideas for explorations, technology advice, modeling methods and a variety of statistical techniques with detailed explanations. I’ve also made 17 full investigation questions which are also excellent starting points for explorations.  The Exploration Guides can be downloaded here and the Paper 3 Questions can be downloaded here.

Hexaflexagons – Amazing Shapes Investigation:

Hexaflexagons look at first glance to be somewhat prosaic origami shapes – but like mobius strips they hide some surprises.  Flexagons are paper shapes that can be folded to reveal hidden faces – and hexaflexagons themselves have six sides.  What’s remarkable about hexaflexagons is that during folding, some faces are harder to find than others – which is somewhat counter-intuitive.  Surely, you would expect to rotate through the faces equally?

Princeton University student Arther Stone discovered flexagons in 1931.  After moving from Britain, he discovered that his paper no longer fit his new American style binders – and so after cutting his paper down to size he started to play around with the left over bits of paper.  In doing so he discovered a new structure to be explored in the mathematical field of topology (study of shapes and space).

You can experiment further by making tetrahexaflexagons (four sided shapes) and different types of hexaflexagons – which have some remarkable properties.  The Vi Hart video at the top of the page serves as an introduction to this topic – and the one below goes into the maths a little more:

If you would like to try and make your own then the template and instructions are available from here.

Some ideas for investigations into flexagons are taken from a fantastic book on the subject by The Art of Mathematics – available to read as a pdf here. I’ve copied some of their text below:

hexaflexagon2

To do some mathematical investigation you first need to learn how to “flex” the flexagon correctly:

1) Hold your Hexahexaflexagon flat.
2) Fold one creased edge up, into a mountain fold
3) Fold the adjacent creased edge down, into a
valley fold
4) Repeat the two previous steps each twice more so you have mountain and valley folds alternating around the six creased edges.
5) If you push the valley folds together, your flexigon will have folded up into a 3-pointed star; a shape that looks almost like a Y from above.
6) With your thumbs grab the point closest to you where the three valleys have come together. You should see that if you pull this point away from the center that the edges fold back down into a flattened hexagon.

That sound pretty difficult – but watch the videos again – it should make sense.

The book also provides some interesting starting questions for investigation:

flexagon

1) As you flex your hexa-hexaflexagon (henceforward simply referred to as a flexagon), what happens to some of the faces?
2) What is happening to the flexagon that allows the faces to disappear and reappear like this?
3) How many different faces do you seem to find as you first start flexing your flexagon?
4) Do you think that there might be more faces that can be found simply by flexing? Try to find some and then list those that you have found by listing the markings on the faces.
5) You should see several patterns in the markings on the faces that you have found. Describe these patterns.
6) Look back at the original strip that you used to make your flexagon. Based on the markings on this original strip, can you guess what other faces should be possible to make by flexing your flexagon?
7) Return again to the original strip you used to create your flexagon. Count how many faces make up this strip. Compare this number with the number of triangular faces that appears on each face of the flexagon.
8) Can you explain why the proper name for this flexagon is a hexa-hexaflexagon based on your investigations so far? Explain.
9) In a given state, how many different ways are there that you can flex your flexagon?
10) In a given state, how many layers thick, including the top layer, are the sections under each triangular face in your flexagon? (Count the two glued layers as a single layer).

If you enjoyed this post you might also like:

Imagining the 4th Dimension. How mathematics can help us explore the notion that there may be more than 3 spatial dimensions.

Wau: The Most Amazing Number in the World? A great video by Vi Hart – see if you can spot the twist!

code2

Cracking RSA Code – The World’s Most Important Code? 

RSA code is the basis of all important data transfer.  Encrypted data that needs to be sent between two parties, such as banking data or secure communications relies on the techniques of RSA code.  RSA code was invented in 1978 by three mathematicians (Rivest, Shamir and Adleman).  Cryptography relies on numerous mathematical techniques from Number Theory – which until the 1950s was thought to be a largely theoretical pursuit with few practical applications.  Today RSA code is absolutely essential to keeping digital communications safe.

To encode a message using the RSA code follow the steps below:

1) Choose 2 prime numbers p and q (let’s say p=7 and q=5)

2) Multiply these 2 numbers together (5×7 = 35).  This is the public key (m) – which you can let everyone know. So m = 35.

3) Now we need to use an encryption key (e).   Let’s say that e = 5.  e is also made public. (There are restrictions as to what values e can take – e must actually be relatively prime to (p-1)(q-1) )

4) Now we are ready to encode something.  First we can assign 00 = A, 01 = B, 02 = C, 03 = D, 04 = E etc. all the way to 25 = Z.  So the word CODE is converted into: 02, 14, 03, 04.

5) We now use the formula: C = ye (mod m) where y is the letter we want to encode.  So for the letters CODE we get: C = 025 = 32 (mod 35). C = 145 = 537824 which is equivalent to 14 (mod 35). C = 035 = 33 (mod 35).  C = 045 = 1024 which is equivalent to 09 (mod 35).  (Mod 35 simply mean we look at the remainder when we divide by 35).  Make use of an online modulus calculator!   So our coded word becomes: 32 14 33 09.

code3

This form of public key encryption forms the backbone of the internet and the digital transfer of information.  It is so powerful because it is very quick and easy for computers to decode if they know the original prime numbers used, and exceptionally difficult to crack if you try and guess the prime numbers.  Because of the value of using very large primes there is a big financial reward on offer for finding them.  The world’s current largest prime number is over 17 million digits long and was found in February 2013.   Anyone who can find a prime 100 million digits long will win $100,000.

To decode the message 11 49 41 we need to do the following:

1) In RSA encryption we are given both m and e. These are public keys.  For example we are given that m = 55 and e = 27.  We need to find the two prime numbers that multiply to give 55.  These are p = 5 and q = 11.

2) Calculate (p-1)(q-1).  In this case this is (5-1)(11-1) = 40.  Call this number theta.

3) Calculate a value d such that de = 1 (mod theta).  We already know that e is 27.  Therefore we want 27d = 1 (mod 40).  When d = 3 we have 27×3 = 81 which is 1 (mod 40).  So d = 3.

4) Now we can decipher using the formula: y = C^d (mod m), where C is the codeword.  So for the cipher text 11 49 41:  y = 113 = 11 (mod 55).  y = 493 = 04 (mod 55). y = 413 = 6 (mod 55).

5) We then convert these numbers back to letters using A = 00, B = 01 etc.  This gives the decoded word as: LEG.

If you enjoyed this post you might also like:

How Are Prime Numbers Distributed? Twin Primes Conjecture. Discussion on studying prime numbers.

Cracking ISBN and Credit Card Codes. The mathematics behind ISBN codes and credit card codes

Essential resources for IB students:

1) Exploration Guides and Paper 3 Resources

Screen Shot 2021-05-19 at 6.32.13 PM

I’ve put together four comprehensive pdf guides to help students prepare for their exploration coursework and Paper 3 investigations. The exploration guides talk through the marking criteria, common student mistakes, excellent ideas for explorations, technology advice, modeling methods and a variety of statistical techniques with detailed explanations. I’ve also made 17 full investigation questions which are also excellent starting points for explorations.  The Exploration Guides can be downloaded here and the Paper 3 Questions can be downloaded here.

The Gorilla in the Room and Other Great Maths Investigations

These topics are a great way to add interest to statistics and probability lessons at KS3 and KS4 level, and also a good example of investigations that IB students can conduct. They also have a nice link to ToK – how can we believe what we see or what we hear?  To what extent should we trust our senses?  And it shows the power of statistics and empirical testing in trying to understand what is externally real and what is our own version of reality.

For each one, have the students make a hypothesis (if possible without giving the endings away!), then collect some data as to how the students react.  Then look at how the data could be collected in a larger scale experiment (or how the experiment could be modified).

The first one at the top of the page is the “Fa, Ba” test.  This is a really curious experiment that shows that what we “hear” is actually often influenced by what we see.

The second one is the amazing colour changing card trick by Richard Wiseman.  This is also a great way of showing how we often fail to see what is really in front of us:

The third video is even more impressive – though it doesn’t work on all students.  You have to set this one up so that all students are really intently concentrating on the screen – perhaps a prize for the student who gets the answer correct?  Also no talking!  Students have to count basketball passes:

The last one is a good test of whether students are “right brain” or “left brain” dominant.  They have to stare at a rotating woman – some students will see this going clockwise, others anticlockwise.  Some will be able to switch between the 2 views.  If they can’t (I initially could only see this going in an anti clockwise direction) near the end of the video it shows the woman rotating in a clockwise direction to help.  Then rewinding the video to the start – and as if by magic she had changed direction.

If you liked this post you might also like:

Even Pigeons Can Do Maths A discussion about the ability of both chimps and pigeons to count

Finger Ratio Predicts Maths Ability? A post which discusses the correlation between the two.

computer simulation

Are You Living in a Computer Simulation?

This idea might be familiar to fans of The Matrix – and at first glance may seem somewhat unbelievable.  However, Oxford University Professor Nick Bostrom makes an interesting case using both conditional probability and logic as to why it’s more likely than you might think.

The summary of Bostrom’s Computer Simulation argument is the following:

At least one of the following propositions is true: (1) the human species is very likely to go extinct before reaching a “posthuman” stage; (2) any posthuman civilization is extremely unlikely to run a significant number of simulations of their evolutionary history (or variations thereof); (3) we are almost certainly living in a computer simulation. It follows that the belief that there is a significant chance that we will one day become posthumans who run ancestor-simulations is false, unless we are currently living in a simulation.

The full paper where he makes his argument is available as a pdf here – and is well worth a read.  Alternatively Bostrom makes this case in a detailed interview:

Taking the argument step by step, firstly when Bostrom talks about a “posthuman” stage he is referring to an advanced civilisation with significantly greater technological capabilities than we have at present.  Such a civilisation would have the ability to run a computer simulation so accurate that it would be indistinguishable from “real life”.

This is a twist on the traditional “Brain in a Vat” thought experiment much loved by philosophers when trying to argue whether we be sure that anything exists outside our own subjective experience:

Based on the same logic, we have no way of genuinely knowing whether we are really “here” or whether we are nothing but a computer model designed to give the impression that we really exist.  Interestingly, the possibility that our individual life, the world around us and indeed everything we know about the universe may be false means that we can never truly claim to have knowledge of anything.

I think that most optimists would think that civilisation has the potential to develop into a “posthuman” phase of advanced technology.  Indeed, you only need to look at the phenomenal growth in computer power (see Moore’s Law) to have confidence that should we stick around long enough, we will have the computational power possible to run such simulations.

So if we optimistically accept that humans will reach a “posthuman” stage, then it’s even easier to accept the second proposition – that if an advanced civilisation is able to run such civilisations they will do.  After all human nature is such that we tend to do things just because we can – and in any case running such ancestor simulations would potentially be very beneficial for real world modelling.

If we do accept both these premises, then this therefore leads to the argument that we are almost certainly living in a computer simulation.  Why?  Well, an advanced civilisation with the computational power to run ancestor simulations would likely run a large number of them – and if there is only one real world, then our experience of a world is likely to be one of these simulations.

As a ToK topic this is a fantastic introduction to epistemological questions about the limits of knowledge and questions of existence, and is a really good example of the power of logic and mathematics to reveal possibilities about the world outside our usual bounds of thinking.

If you enjoyed this post you might also like:

Imagining the 4th Dimension – How mathematics can help us explore the notion that there may be more than 3 spatial dimensions.

Is Maths Invented or Discovered? – A discussion about some of the basic philosophical questions that arise in mathematics.

Essential resources for IB students:

1) Exploration Guides and Paper 3 Resources

Screen Shot 2021-05-19 at 6.32.13 PM

I’ve put together four comprehensive pdf guides to help students prepare for their exploration coursework and Paper 3 investigations. The exploration guides talk through the marking criteria, common student mistakes, excellent ideas for explorations, technology advice, modeling methods and a variety of statistical techniques with detailed explanations. I’ve also made 17 full investigation questions which are also excellent starting points for explorations.  The Exploration Guides can be downloaded here and the Paper 3 Questions can be downloaded here.

Website Stats

  • 9,358,218 views

About

All content on this site has been written by Andrew Chambers (MSc. Mathematics, IB Mathematics Examiner).

New website for International teachers

I’ve just launched a brand new maths site for international schools – over 2000 pdf pages of resources to support IB teachers.  If you are an IB teacher this could save you 200+ hours of preparation time.

Explore here!

Free HL Paper 3 Questions

P3 investigation questions and fully typed mark scheme.  Packs for both Applications students and Analysis students.

Available to download here

IB Maths Super Exploration Guide

A Super Exploration Guide with 168 pages of essential advice from a current IB examiner to ensure you get great marks on your coursework.

Available to download here.

Recent Posts

Follow IB Maths Resources from Intermathematics on WordPress.com